The Bumpy Road to Long-Term Stock Market Returns
Greetings!
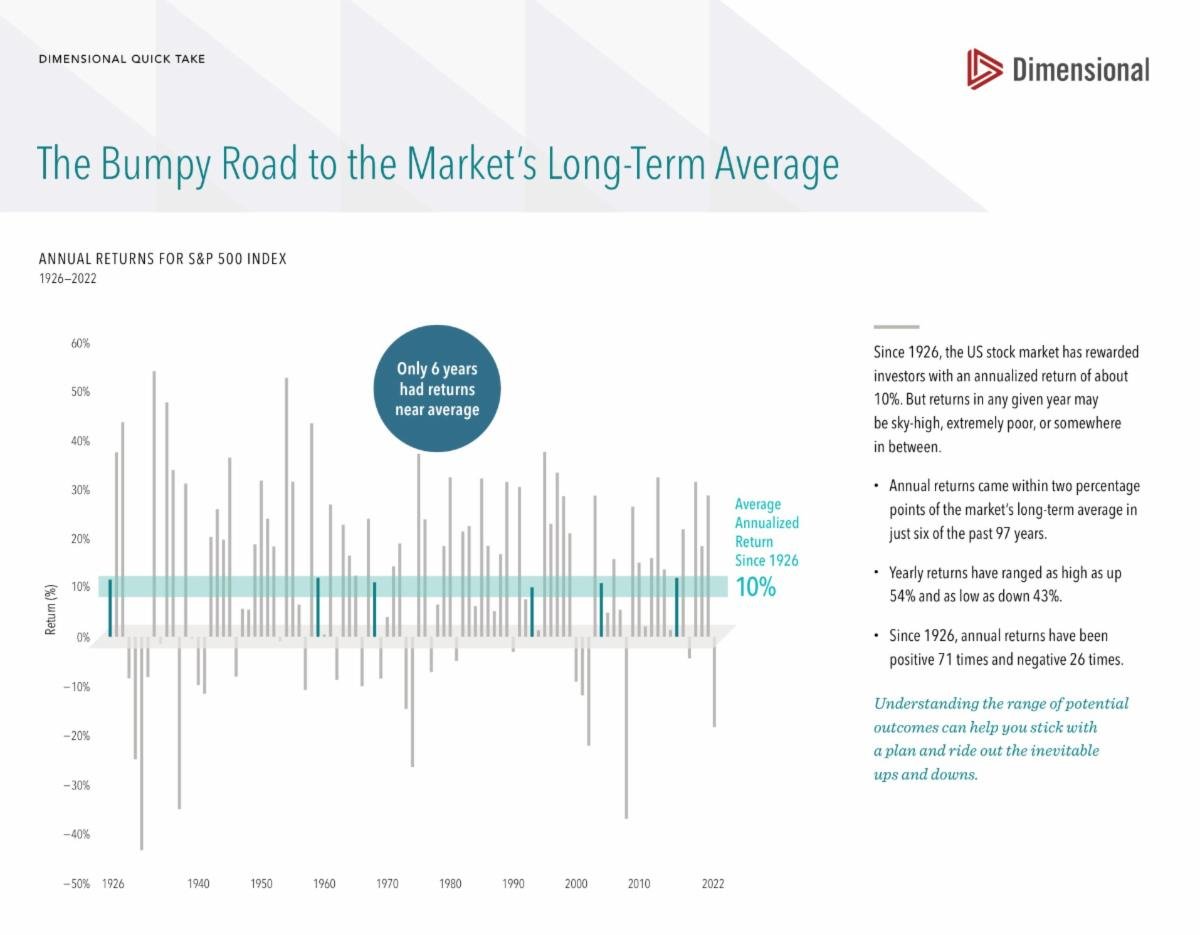
I came across this chart recently and it's been one of my favorites to share.
Key Points:
- Since 1926 the best and largest companies in the US bundled together, aka the S&P 500, has delivered an average annual return of 10%.
- Had your grandparents started putting $100/mo in 1926 - 1956, your parents continued the $100/mo from 1956 - 1986 and you continued the $100/mo from 1986 - 2023 the account value on that fund would be $188 million dollars today. Ok I admit that was for shock value, when in reality $100/mo was a lot of money in 1926 so if we take into account inflation of 3% over this nearly 100 year period the fund would be worth ONLY (said sarcastically) ~$15 million today. Not too bad for only putting in $116,400 over that time frame
- Going back to the chart: the actual annual returns only fell within 2% of the 10% average SIX times out of the last 97 years.
- The yearly returns ranged anywhere from down 43% to up 54%.
- And since 1926, annual returns have been positive 71 times and negative 26 times...if you flipped a coin 4 times 3 out of the 4 times it would be positive
- Cue the title of the chart: it's a bumpy road to the long term average
Form 5498
I have received some questions around people receiving Form 5498 in the month of May, after the tax filing deadline.
Form 5498 shows your IRA contributions. These forms are always sent after the deadline.
The reason being is because you have until mid-April to contribute to IRAs for the previous year, so these forms don’t generate until around Mid-May. Some CPAs wait to complete your return by filing an extension until these forms come out. Others just ask you whether you contributed to any IRAs or not if they are filing your return prior to the mid-April deadline.
Historical article · Originally published June 2023. Market data and tax rules reflect the original publication date. Past performance is not a guarantee of future results. Editorial and compliance review pending.